example
Input Quality Assessment
example.0
example.1
Statistics
| source: example_result/example.0_bwamem.sort.rmdup.readfiltered.bam | |
| QC-passed reads | 294058 |
| QC-failed-reads | 0 |
| Duplicates | 0 |
| Mapped reads | 201139(68.40%) |
| Paired reads | 294058 |
| Read1 | 144504 |
| Read2 | 149554 |
| Properly paired | 167300(56.89%) |
| Reads with itself and mate mapped | 201118 |
| Singletons | 21(0.01%) |
| Reads with mate mapped to a different chromosome | 42735 |
| Reads with mate mapped to a different chr (mapQ at least 5) | 42735 |
| source: example_result/example.0_bwamem.sort.rmdup.readfiltered.bam | |
| total length (defined by /auto/rcf-proj/kw/yunfeigu/Downloads/SeqMule/misc/hg19_exome.bed) | 46.21Mb |
| Fraction of reads mapped to target region | 12.83% |
| Average coverage in target region | 0.04 |
| Percentage above 30 | 0.03% |
| Percentage above 20 | 0.05% |
| Percentage above 10 | 0.09% |
| Percentage above 5 | 0.16% |
| source: example_result/example.0_bwamem.sort.rmdup.readfiltered.realn.0_gatklite.extract.vcf | |
| Sample | example |
| Number of variants | 54 |
| Number of SNVs | 52 |
| Number of indels | 2 |
| Transitions | 24 |
| Transversions | 28 |
| Ti/Tv Ratio | 0.86 |
| Ref/Alt heterozygotes | 27 |
| Homozygotes | 27 |
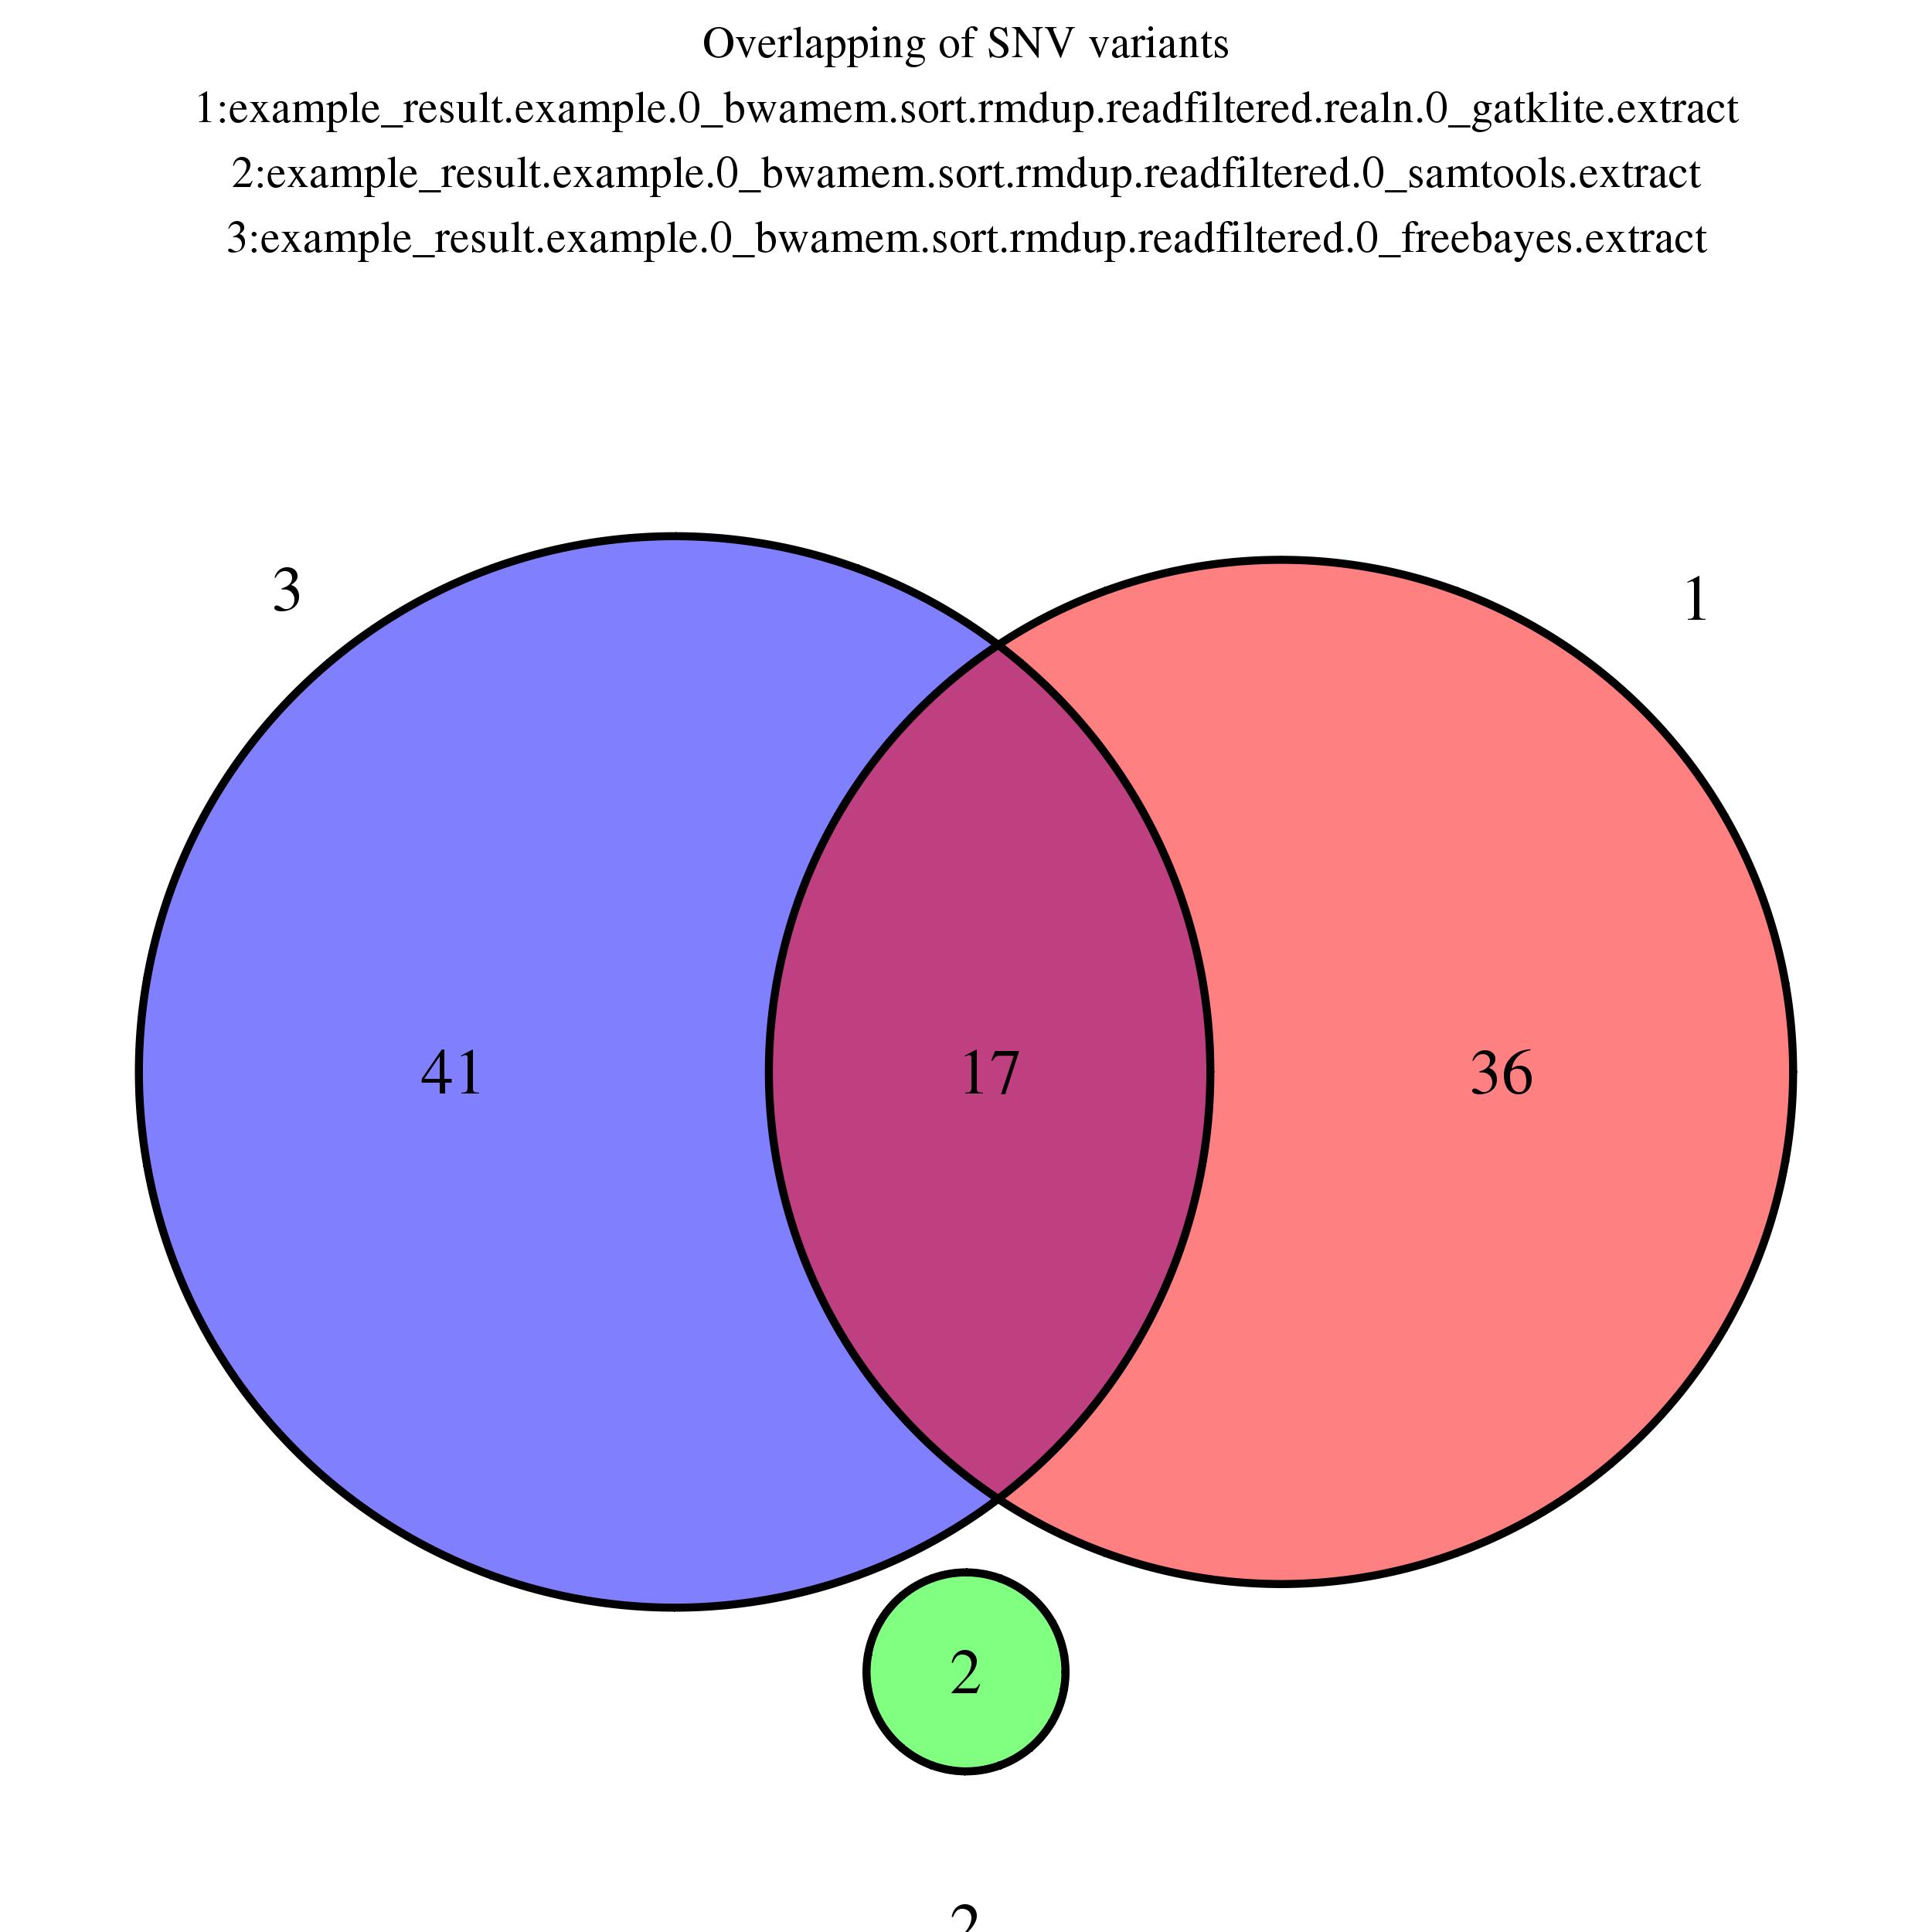
Venn Diagram (SNV)
Showing overlapping of up to 5 SNV variant output
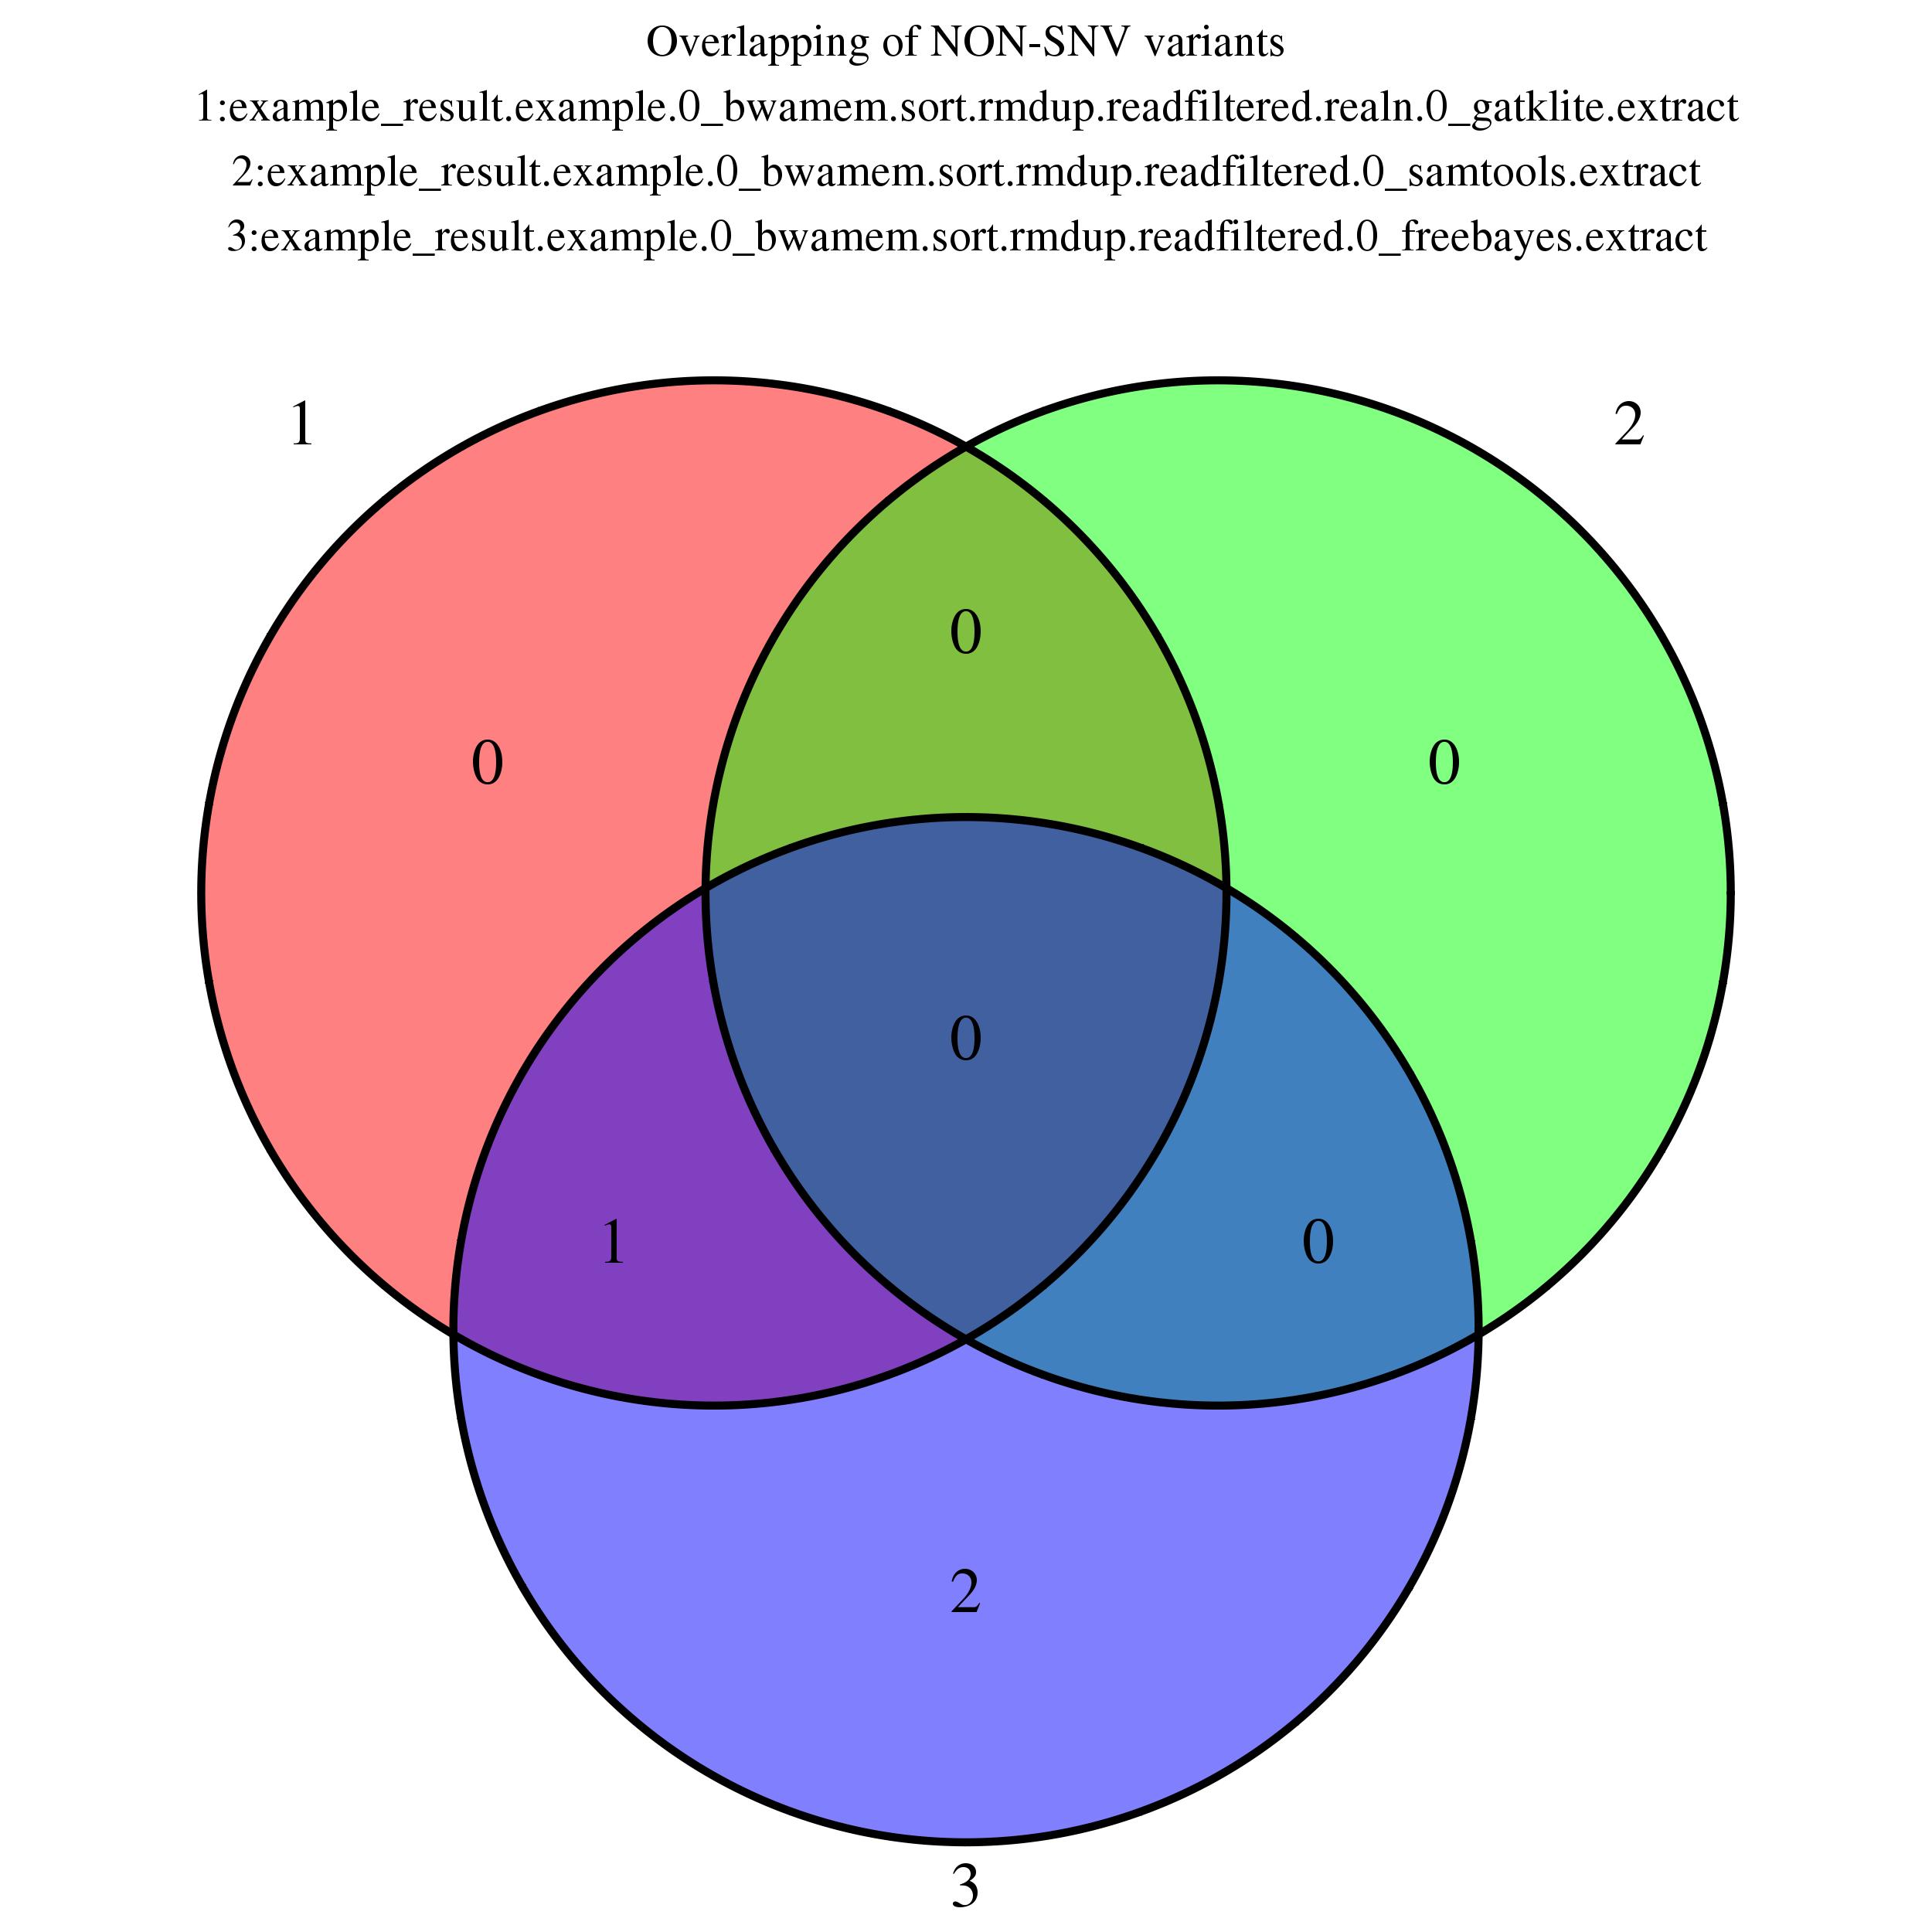
Venn Diagram (non-SNV)
Showing overlapping of up to 5 NON-SNV variant output
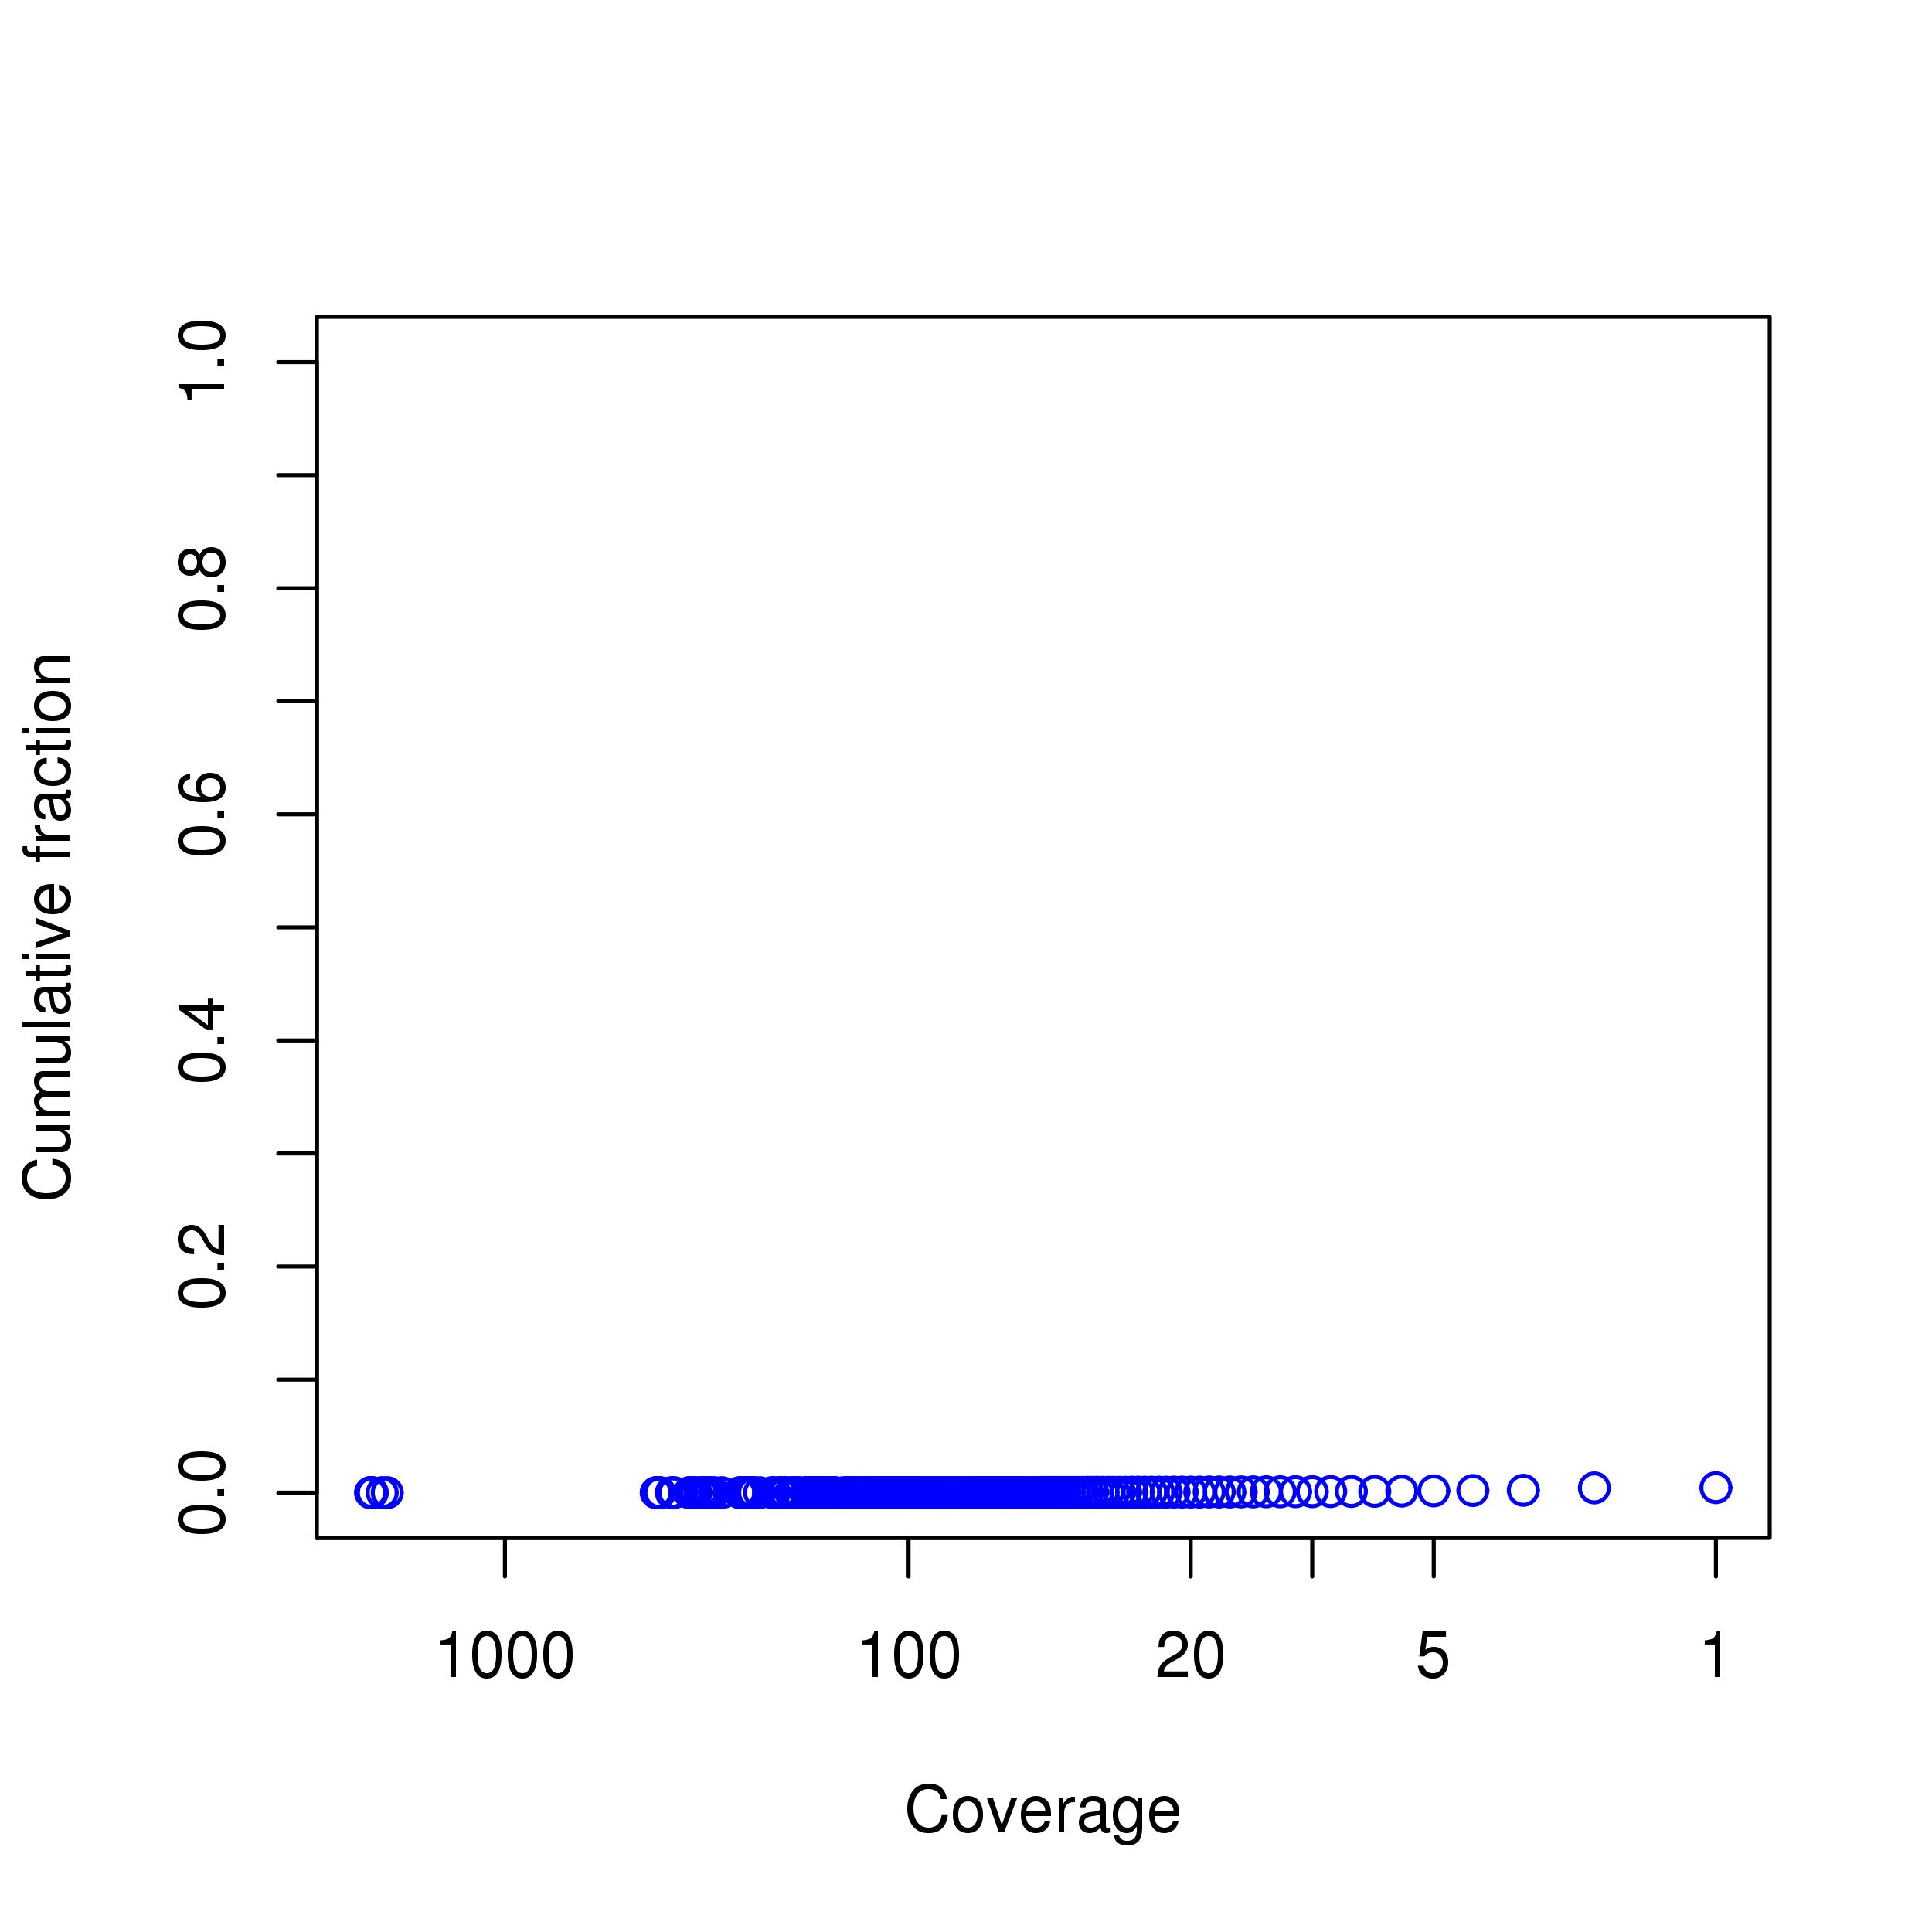
Coverage Plot